
Statistical Clustering in Business
Clustering in business, based on statistics, can be a powerful tool for extracting meaningful insights from data and making data-driven decisions. Statistics plays a crucial role in various aspects of clustering, from choosing the right clustering algorithm to evaluating and interpreting the results. Here are some ways in which statistics is involved in clustering.
Distance Metrics
Statistics is used to define distance metrics or similarity measures that quantify how similar or dissimilar data points are. Common distance metrics include Euclidean distance, cosine similarity, and correlation coefficients. These metrics are fundamental for many clustering algorithms.
Determining the Number of Clusters
Statistics offers techniques to determine the optimal number of clusters (K) in a dataset. Methods like the Elbow Method, Silhouette Score, and Gap Statistics use statistical criteria to help identify the number of clusters that best fit the data.
Centroid Computation
In centroid-based clustering algorithms like K-Means, are used to calculate the centroids of clusters. The mean of a cluster is a statistical measure computed by summing the values of data points and dividing by the number of data points in the cluster.
Cluster Validation
Statistics is employed to evaluate the quality of clustering results. Various metrics, such as the Davies-Bouldin Index, Dunn Index, and Rand Index, provide statistical measures to assess the separation and cohesion of clusters.
Hierarchical Clustering Statistics
In hierarchical clustering, statistics is used to determine the optimal level of granularity for cluster formation. This can involve statistical tests or criteria to decide when to stop merging or splitting clusters in the hierarchy.
Cluster Profiling
After clustering, statistical analysis can be applied to understand the characteristics of each cluster. This may involve calculating the mean, median, and variance for each cluster’s attributes and conducting hypothesis tests to identify significant differences between clusters.
Statistical Significance Testing
In some cases, statistical tests are used to determine whether observed differences between clusters are statistically significant or merely due to chance. This can help validate the meaningfulness of clusters.
Principal Component Analysis
Principal Component Analysis is a statistical technique often used in dimensionality reduction before clustering. It helps reduce the dimensionality of data while preserving most of its variability, making clustering more efficient.
Model Selection
When choosing a clustering algorithm, statistical techniques like cross-validation can be applied to assess the performance of different algorithms and select the one that best fits the data.
Time-Series Clustering
In time-series data, statistics is used to extract features, calculate distances, and identify patterns in order to cluster time-series data effectively.
Probability Distributions
Some clustering algorithms, such as Gaussian Mixture Models, use statistical probability distributions to model clusters. Gaussian Mixture Models assume that each cluster follows a particular probability distribution.
Statistical Visualization
Visualization techniques, such as scatter plots, dendrograms, and heatmaps, are used to visualize clustering results and patterns in the data.
Applications of Clustering
Clustering has a wide range of applications, including customer segmentation, image segmentation, anomaly detection, document clustering, and more.
It helps organizations gain insights from their data, make informed decisions, and improve various aspects of their operations. Here are some common applications of clustering in business.
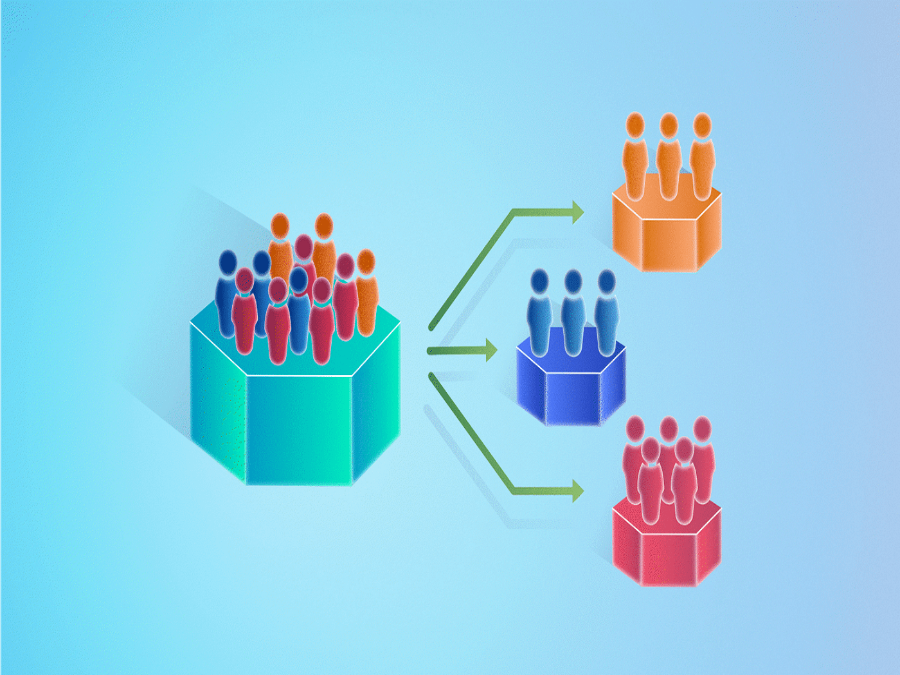
Customer Segmentation
Clustering is widely used in marketing to group customers into segments based on similar behavior, preferences, or purchasing patterns. By identifying distinct customer segments, businesses can tailor their marketing strategies, product offerings, and customer support to better meet the needs of each group.
Market Basket Analysis
In retail and e-commerce, clustering can be used to identify products that are frequently purchased together. This information can be used for cross-selling and recommendations, helping businesses increase sales and customer satisfaction.
Anomaly Detection
Clustering can be used to detect anomalies or outliers in data. This is valuable in fraud detection, network security, and quality control. Unusual patterns can be identified by clustering data points that deviate significantly from the norm.
Location-Based Services
In industries such as retail, real estate, and logistics, clustering can be used to identify optimal locations for new stores or warehouses. It considers factors like customer demographics and proximity to suppliers and competitors.
Credit Risk Assessment
In the financial sector, clustering can be used to segment borrowers based on their creditworthiness. This helps banks and lending institutions assess the risk associated with different customer groups and set appropriate lending terms.
Supply Chain Optimization
Clustering can be applied to optimize supply chain logistics by grouping products with similar shipping requirements or delivery routes. It streamlines the distribution process and reduces transportation costs.
Employee and Talent Management
In human resources, clustering can be used to categorize employees based on skills, performance, or training needs. It aids in resource allocation, talent development, and succession planning.
Market Research
Clustering can be used to group survey respondents or market data into segments with similar attitudes, preferences, or demographics. This helps businesses understand their target audience better and tailor their products or services accordingly.
Content Personalization
In online platforms, clustering can be used to group users with similar browsing or viewing habits. This information is then used to provide personalized content recommendations, enhancing user engagement.
Manufacturing and Quality Control
Clustering can be applied to identify defects or anomalies in manufacturing processes. It helps maintain product quality and reduce production errors.
Healthcare
In healthcare, clustering can be used for patient segmentation based on health data, aiding in personalized treatment plans and resource allocation.
Conclusion
Statistics is an integral part of clustering, helping to define distance metrics, determine the number of clusters, assess cluster quality, and make sense of the resulting clusters. It enables data scientists and analysts to apply rigorous methodologies for grouping data points effectively based on their similarities or dissimilarities. In business, statistics plays a crucial role in data pre-processing, cluster validation, and interpretation of results for business decision-makers.
Source