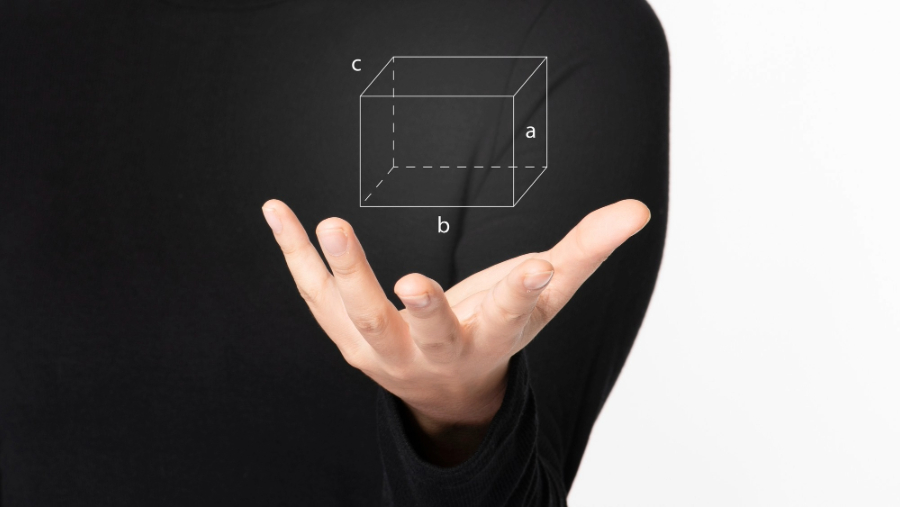
Visualizing Mathematical Concepts with GeoGebra
Mathematics can be a challenging subject for many students, often because it involves abstract concepts and complex equations. However, one of the most effective ways to understand and appreciate mathematics is through visualization. Visualizing mathematical concepts not only makes them more accessible but also helps in deepening one’s understanding. GeoGebra, a dynamic mathematics software, has emerged as a powerful tool for achieving this goal. In this blog post, we will explore how GeoGebra can be used to visualize mathematical concepts and enhance your learning experience.
What is GeoGebra?
GeoGebra is a free and open-source mathematics software that combines geometry, algebra, spreadsheets, graphing, statistics, and calculus. It was created by Markus Hohenwarter in 2001 and has since become a widely used tool in mathematics education worldwide. GeoGebra provides a user-friendly interface that allows students, teachers, and mathematicians to create, manipulate, and explore mathematical models and concepts in a dynamic way.
Visualizing Geometry
Geometry is a branch of mathematics where visualization plays a crucial role. GeoGebra makes it easy to create and manipulate geometric figures. Users can draw points, lines, circles, polygons, and more, and then dynamically change their properties. For example, to understand the concept of congruence, one can create two triangles and use GeoGebra to show how they are congruent by dragging and rotating one triangle to match the other. This interactive approach helps students grasp geometric principles more effectively.
GeoGebra also allows users to explore transformations, such as translations, reflections, rotations, and dilations, by applying these operations to shapes and observing how they change. This hands-on experience helps demystify the abstract notions of transformations and their properties.
Visualizing Algebra
Algebraic concepts can often seem abstract and disconnected from the real world. GeoGebra bridges this gap by providing a platform for visualizing algebraic expressions and equations. Users can plot functions, create graphs, and explore the relationship between variables.
For example, when studying quadratic equations, students can input a quadratic function into GeoGebra and observe how changing the coefficients affects the shape and position of the parabola. This visual feedback helps learners understand how different parameters influence the behavior of the function.
GeoGebra also supports simultaneous graphing of multiple functions, making it an excellent tool for exploring concepts like systems of equations and inequalities. Students can shade regions of the graph to represent solution sets, providing a clear visual representation of solution spaces.
Visualizing Calculus
Calculus is often considered one of the most challenging branches of mathematics due to its abstract nature. GeoGebra can help students grasp calculus concepts by providing a dynamic environment for visualizing functions, derivatives, integrals, and more.
For instance, when studying the derivative of a function, students can plot a function and its tangent line at a specific point. As they move the point along the curve, they can observe how the slope of the tangent line changes, helping them develop an intuitive understanding of the derivative as the rate of change.
GeoGebra also supports the visualization of definite and indefinite integrals. Students can shade the area under a curve to illustrate the concept of integration as the accumulation of small quantities. This approach makes calculus more accessible by connecting it to the concept of area.
GeoGebra in Education
GeoGebra’s potential as an educational tool is vast. Teachers can use GeoGebra to create interactive lessons and assignments that engage students and promote active learning. The software also provides a platform for exploring mathematical concepts collaboratively, whether in a physical classroom or a virtual learning environment.
Moreover, GeoGebra offers a wealth of ready-made materials in its online repository, where educators can find pre-designed applets, worksheets, and lessons covering a wide range of topics and difficulty levels. These resources can be customized to suit specific learning objectives and classroom needs.
Real-world Applications
Beyond the classroom, GeoGebra has practical applications in various fields. Engineers, architects, and designers can use it to visualize and analyze geometric constructions, spatial relationships, and complex equations. Scientists can employ GeoGebra to model and simulate mathematical systems in physics, chemistry, and biology.
GeoGebra’s versatility extends to financial modeling, data analysis, and statistical visualization. It can help professionals in finance and economics explore complex mathematical models and gain insights from data by creating interactive graphs and plots.
Conclusion
Mathematics, often perceived as an abstract and intimidating subject, can become more accessible and enjoyable through visualization. GeoGebra, with its dynamic and interactive capabilities, empowers learners of all ages to explore and understand mathematical concepts in a visual and intuitive way. Whether you’re a student seeking to grasp challenging topics or an educator looking to enhance your teaching methods, GeoGebra is a valuable tool that can transform the learning experience and make mathematics come alive. So, don’t be afraid to dive into the world of mathematics with GeoGebra and discover the beauty and power of visualizing mathematical concepts.
Source
- https://www.geogebra.org/math
- https://ibmathsresources.com/2014/03/25/visualising-algebra-through-geometry/
- https://www.math.tamu.edu/~tkiffe/calc3/
- https://beautyofcreation.medium.com/digital-innovation-geogebra-11ee9804b0e1

